Unlocking Project Success: Spaceberry’s Impactful Research and Discovery Approach
By Spaceberry Studio 9 min reading Jul 17, 2023

At Spaceberry, we firmly believe that UX research is the heart and soul of our work. Throughout every stage of the design process, we leverage various research methods to keep our product-development efforts on track. By attentively listening to users and understanding their needs, we can craft custom web designs that truly resonate with our target audience.
Now, let’s delve into the UX research methods we employ at Spaceberry Studio and how they enable us to deliver outstanding products that exceed expectations.
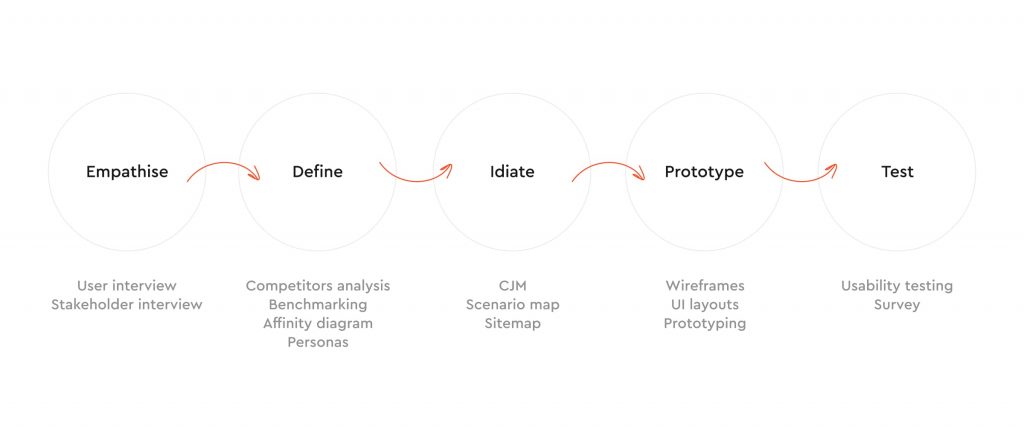
User Interviews
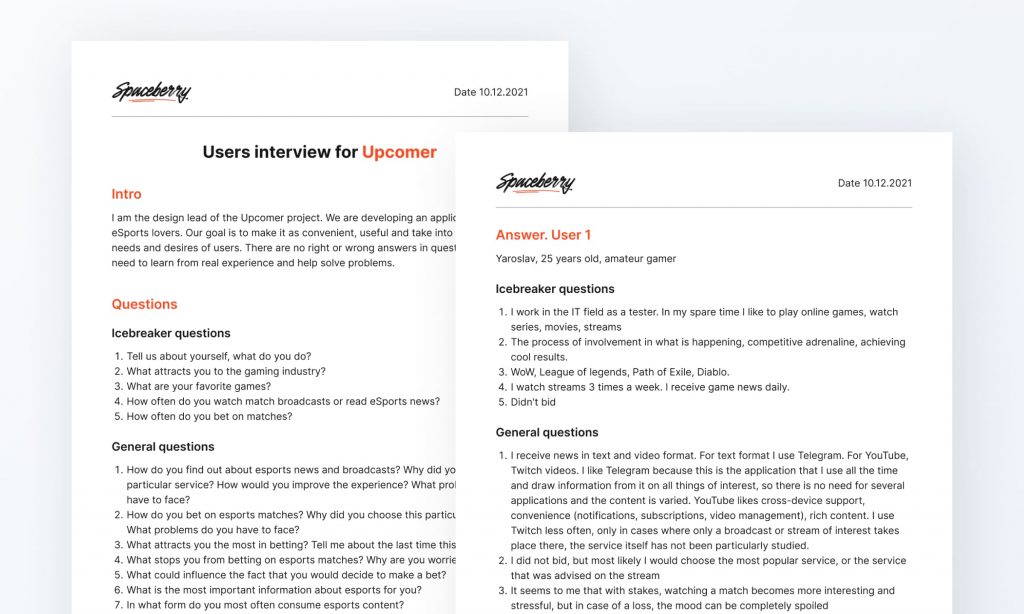
What is it?
One-on-one conversations with users to gather information about their experiences, needs, and goals.
Why do we use it?
To understand users’ perspectives, uncover pain points, and gain insights for product improvement.
How do we do it?
We conduct one-on-one interviews with users, asking open-ended questions to gather insights about their needs, preferences, and pain points. The process involves preparing interview questions, conducting the interview, and analyzing the responses. The artifact obtained is qualitative data, such as interview transcripts or summaries in Google Docs or Google Forms, which provide valuable insights into user perspectives, motivations, and behaviors.
Stakeholder Interviews
What is it?
Conversations with important people involved in a project.
Why do we use it?
To identify key priorities, constraints, and expectations, enabling us to strike a balance between business requirements and user-centered design.
How do we do it?
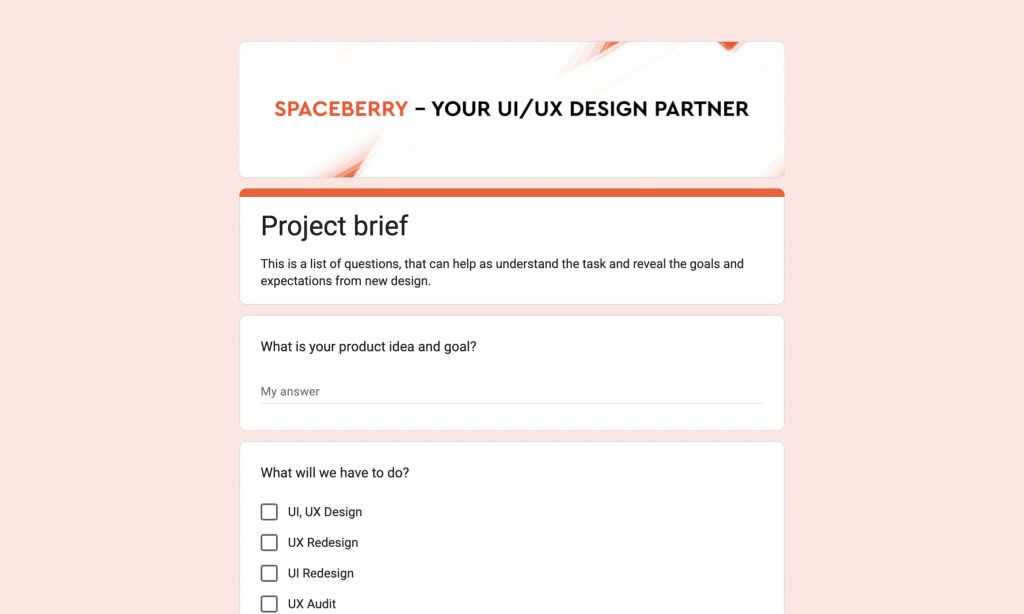
We engage in interviews with project stakeholders to understand their goals, expectations, and requirements. The process involves scheduling and conducting interviews, discussing project objectives, and documenting stakeholder insights. The artifact obtained is a compilation of stakeholder feedback and requirements in Google Docs or Google Forms, which helps align business objectives with user needs and guides the design process.
Competitors analysis
What is it?
The process of researching and analyzing the strengths and weaknesses of competing products.
Why do we use it?
To identify gaps in the market, understand user expectations, and improve upon existing products.
How do we do it?
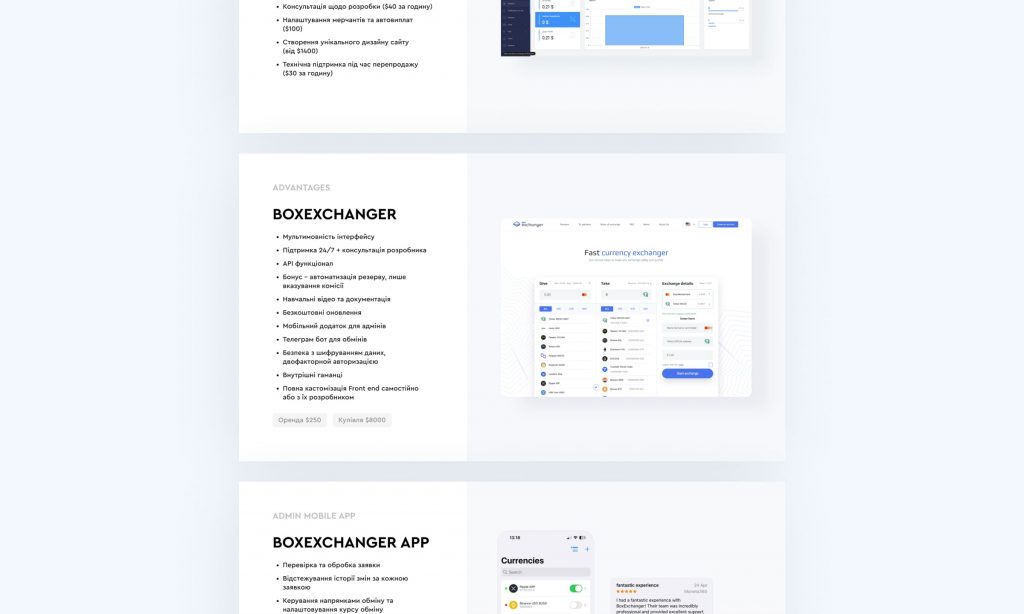
We analyze the products and services offered by key competitors in the market. The process involves researching competitors, evaluating their features, and documenting the findings. The artifact obtained is a comprehensive presentation in Figma that highlights the strengths and weaknesses of competitors, enabling us to identify opportunities for improvement and refine our own product strategy.
Benchmarking
What is it?
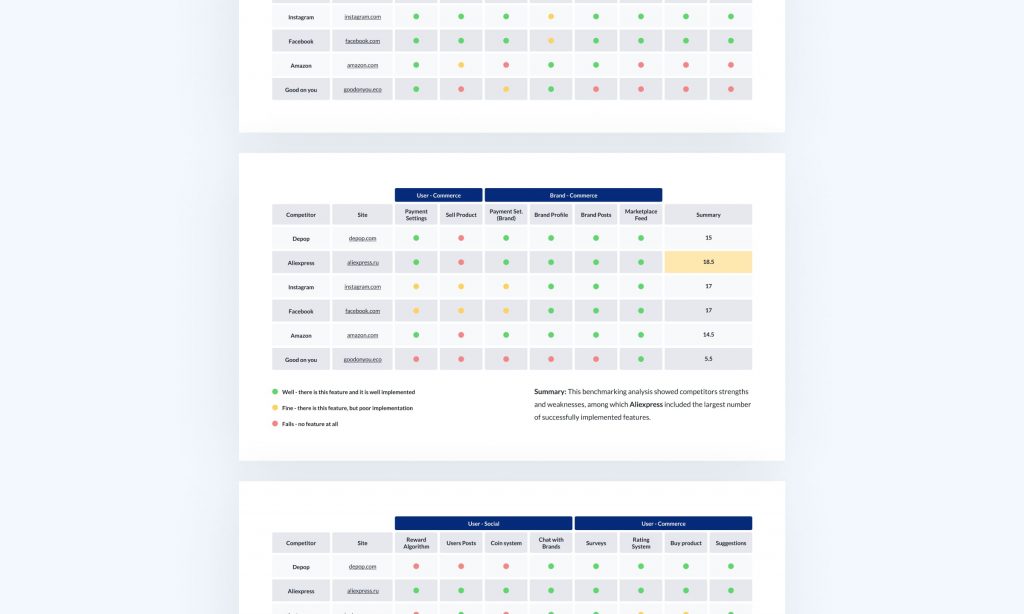
The process of comparing a product or service to similar products or services in the market to evaluate its performance.
Why do we use it?
To identify areas for improvement and set performance goals.
How do we do it?
We compare our designs or similar products against industry standards and best practices. The process involves researching established benchmarks, evaluating, and documenting the findings. The artifact obtained is a benchmark report in Figma that highlights areas of excellence and areas for improvement, guiding us to achieve higher design standards.
Affinity diagram
What is it?
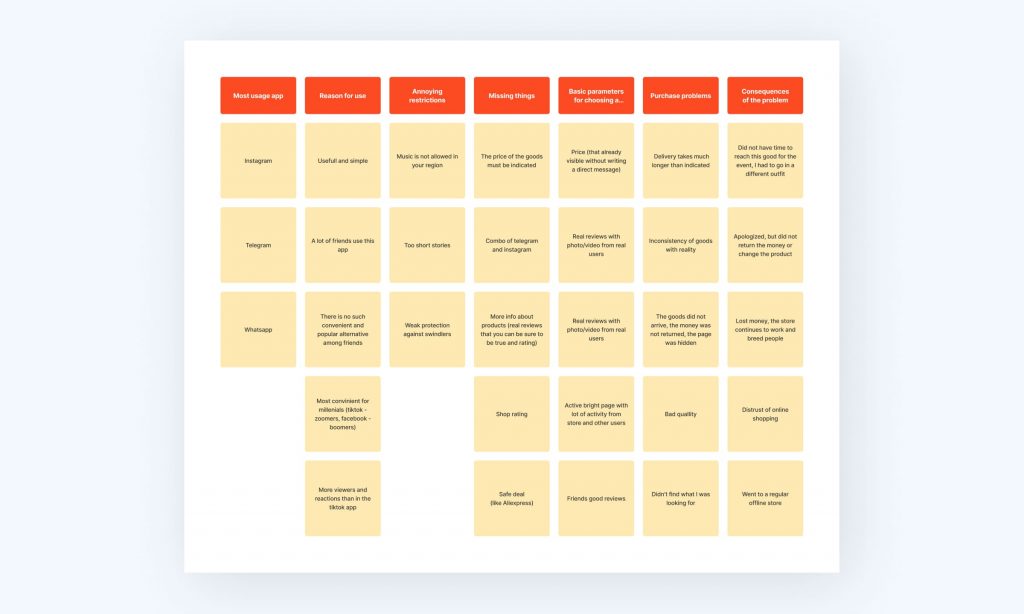
A method of organizing and grouping data or ideas to identify patterns and themes.
Why do we use it?
The affinity diagram is an invaluable tool in our UX research arsenal, enabling us to organize and categorize common scenes and trends.
How do we do it?
We use affinity diagrams to organize and categorize research findings, insights, and ideas. The process involves gathering research data, identifying common themes or patterns, and arranging them into meaningful groups or categories. The artifact obtained is a visual representation of the organized data in Figma, helping us identify connections and relationships between user data points and inform design decisions.
Personas
What is it?
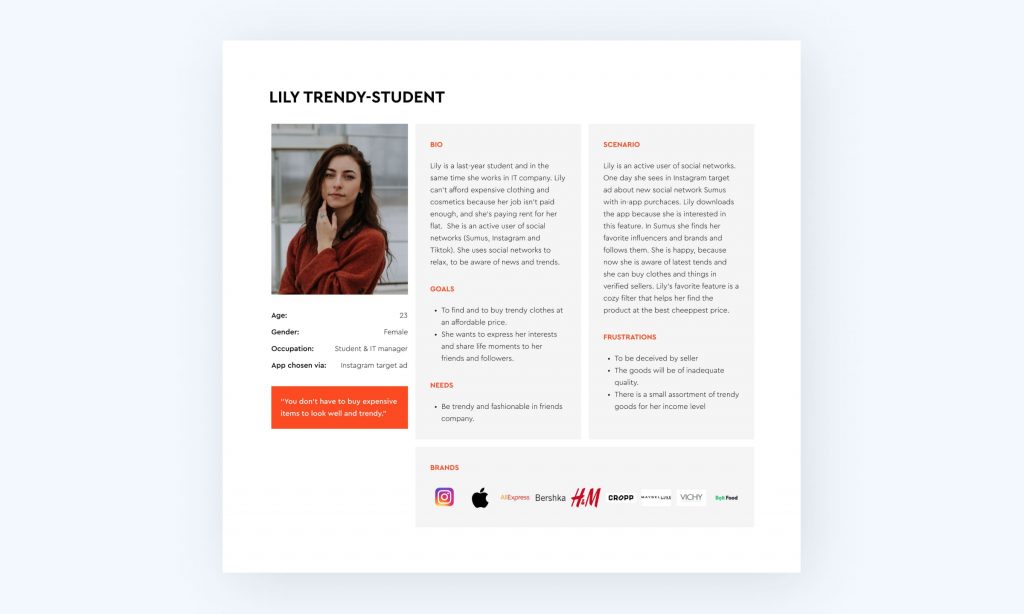
A fictional representation of a user group based on research data to help design for their needs and behaviors.
Why do we use it?
To create a user-centered design by understanding user goals, needs, and behaviors.
How do we do it?
We create fictional personas based on research data and demographic information. The process involves analyzing user research, identifying common characteristics and behaviors, and creating detailed profiles that represent specific user segments. The artifact obtained is a set of 2-3 persona profiles in Figma that humanize user data, providing a shared understanding of user needs, goals, and behaviors, and guiding design decisions.
Customer journey map
What is it?
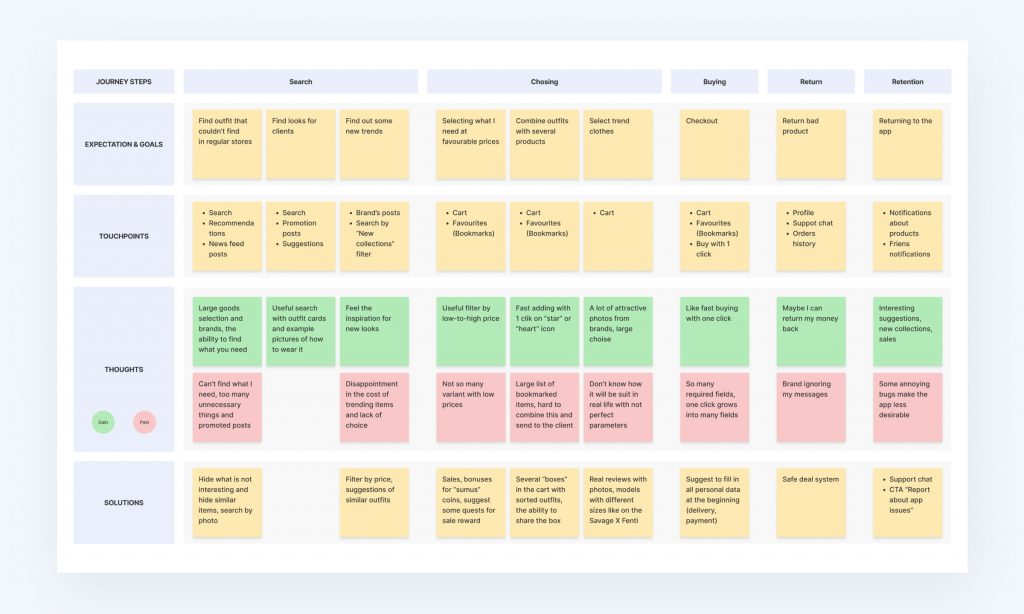
A visual representation of a user’s journey through a product or service, including touchpoints and emotions.
Why do we use it?
The customer journey map plays a crucial role in our UX research process to identify pain points and opportunities for improvement in the user journey.
How do we do it?
We map out the user’s end-to-end experience, including touchpoints, emotions, and pain points, to understand the user journey. The process involves conducting research, identifying key stages and touchpoints, and visualizing the user journey using maps. The artifact obtained is a visual representation of the customer journey in Figma, helping us identify opportunities for improvement, align our design efforts, and prioritize user needs.
Scenario map
What is it?
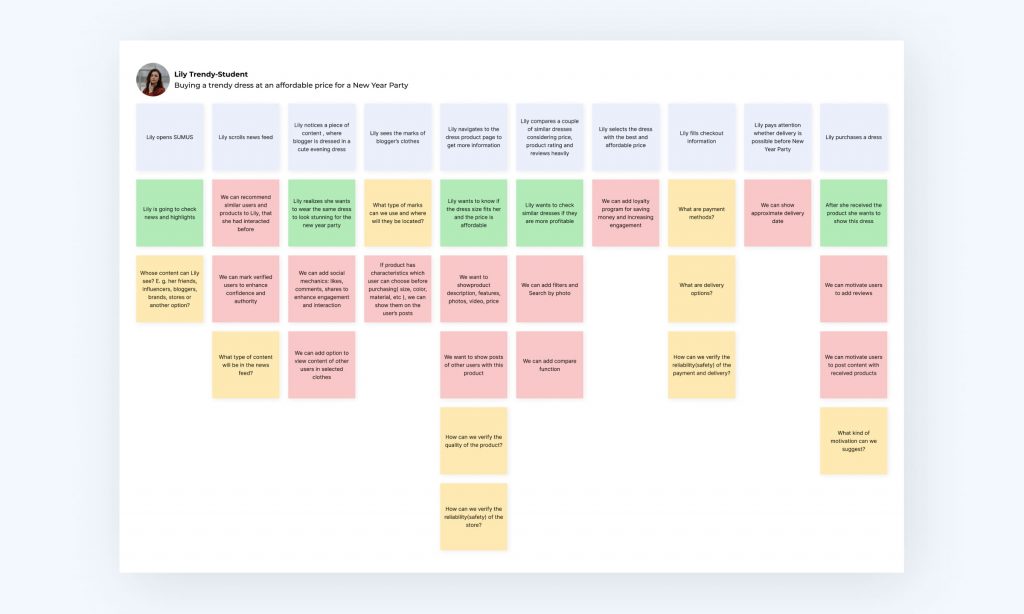
A visual representation of a hypothetical situation or scenario that a user might experience.
Why do we use it?
Scenario maps serve as invaluable tools in our design process, allowing us to visualize user interactions in various scenarios and contexts.
How do we do it?
We create scenario maps to visualize user interactions in different contexts or situations. The process involves identifying user scenarios, mapping out user actions, needs, and potential pain points, and visualizing them using diagrams or flowcharts. The artifact obtained is a visual representation of user scenarios in Figma, guiding the design process by considering various user contexts and ensuring user-centered experiences.
Information Architecture
What is it?
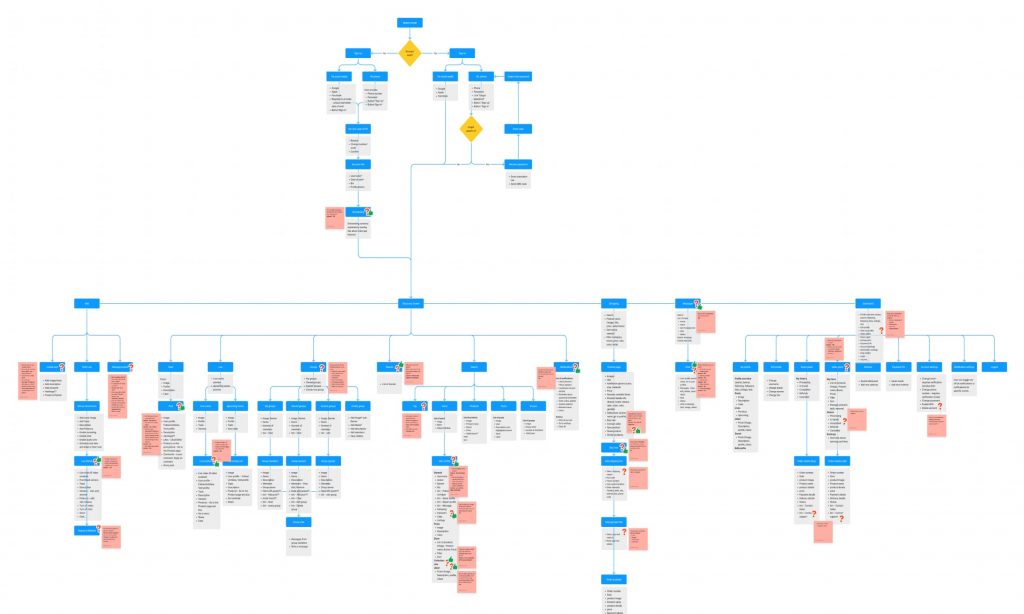
A visual representation of a product’s structure, including its pages and navigation hierarchy.
Why do we use it?
Information architecture is a crucial aspect of the design process that focuses on structuring and organizing the content of a website or application that enhances the usability of the product and contributes to a positive user journey.
How do we do it?
We create a diagram that outlines the hierarchical structure and navigation flow of a website or application. The process involves organizing content, determining the information architecture, and designing the information architecture using diagrams or flowcharts. The artifact obtained is a visual representation of the website’s or application’s structure in FigJam, guiding the organization of content.
Wireframes
What is it?
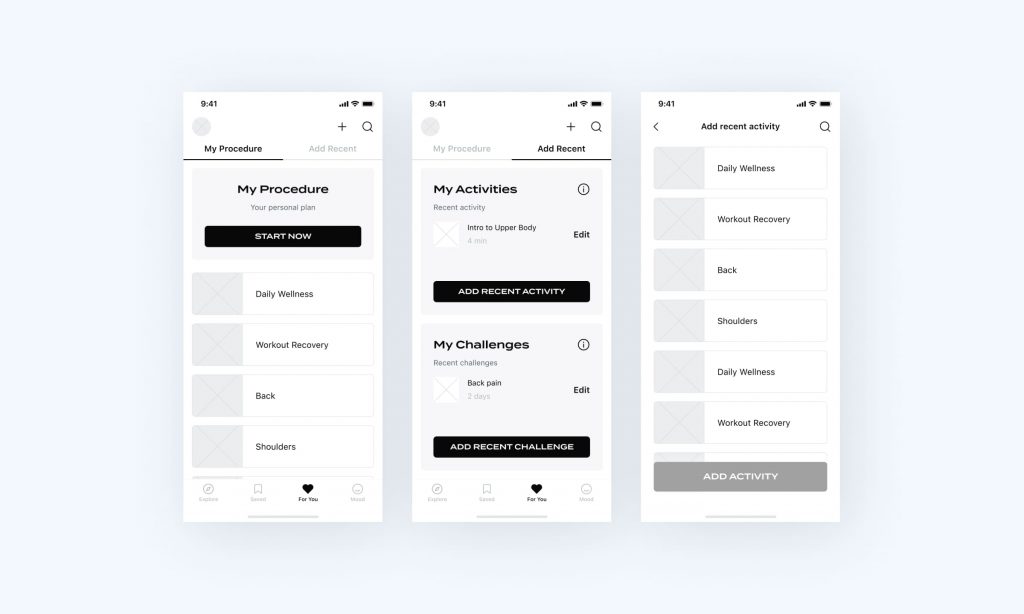
A low-fidelity, visual representation of a website or application’s user interface that outlines its layout and content.
Why do we use it?
To plan the layout and content of the product and test its functionality.
How do we do it?
We create low-fidelity wireframes that represent the structure and placement of elements in the user interface. The process involves wireframing in Figma using simple forms and approximate content. The artifact obtained is a set of black & white wireframes that serve as blueprints for the final design, showcasing the overall layout, information hierarchy, and interaction patterns.
UI layouts
What is it?
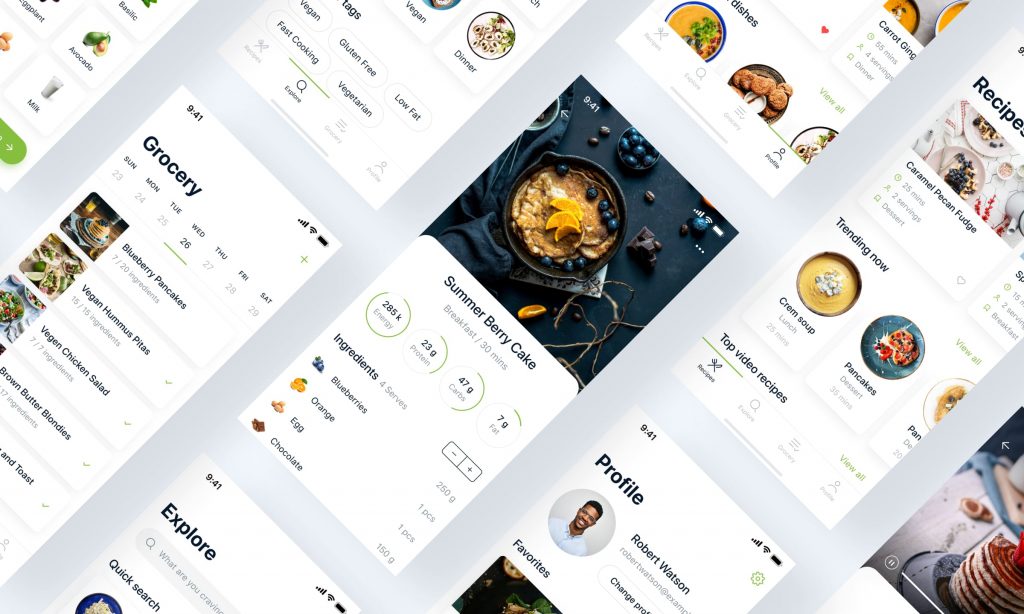
A high-fidelity, final visual representation of a website or application’s user interface design.
Why do we use it?
To ensure that the design is visually appealing and meets user needs and expectations.
How do we do it?
We craft pixel-perfect UI layouts that depict the final appearance and structure of the user interface. The artifact obtained is a set of UI layouts in Figma that serves as blueprints for developers to accurately implement the user interface’s visual aspects.
Prototyping
What is it?
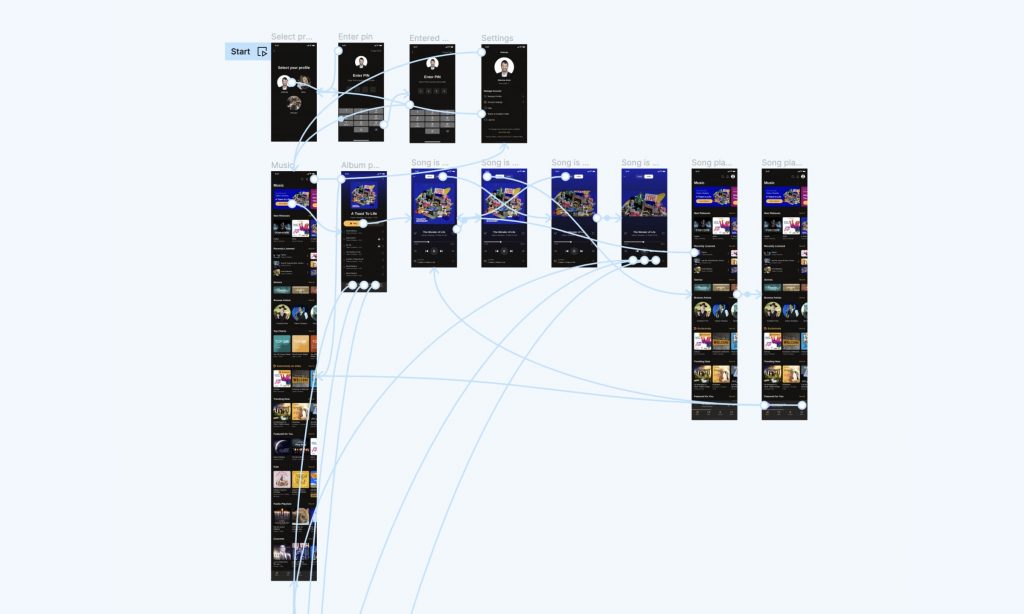
Creating a working model of a product or service to test its functionality and usability.
Why do we use it?
To test and improve the design’s functionality and user experience.
How do we do it?
We build interactive prototypes that simulate the user experience and interactions. The process involves creating connections between wireframes or UI layouts using prototyping tools in Figma. The artifact obtained is an interactive representation of the product in Figma, allowing us to validate design concepts, gather user feedback, and refine the user experience before development.
Usability testing
What is it?
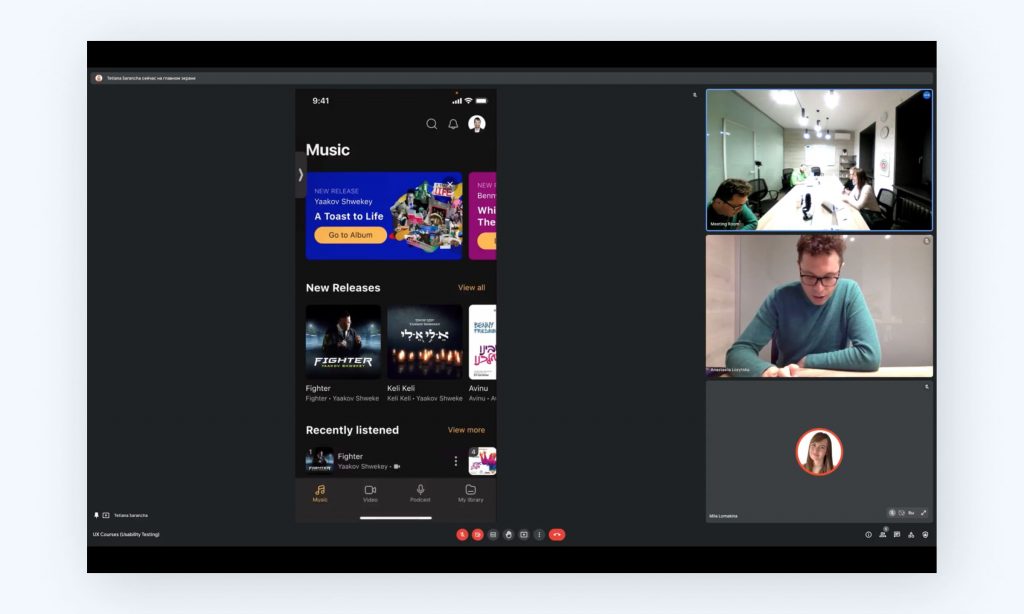
The process of evaluating a product or service’s usability through testing with real users.
Why do we use it?
To identify and address usability issues and improve the user experience.
How do we do it?
We observe users interacting with our designs, collecting feedback, and identifying usability issues. The process involves preparing test scenarios in text format, selecting users for research, conducting online or offline user testing sessions, and analyzing the results. The artifact obtained is a usability testing report in Google Docs that summarizes the findings, including insights on user behavior, pain points, and recommendations for improvement, helping us refine the design and enhance usability.
Survey
What is it?
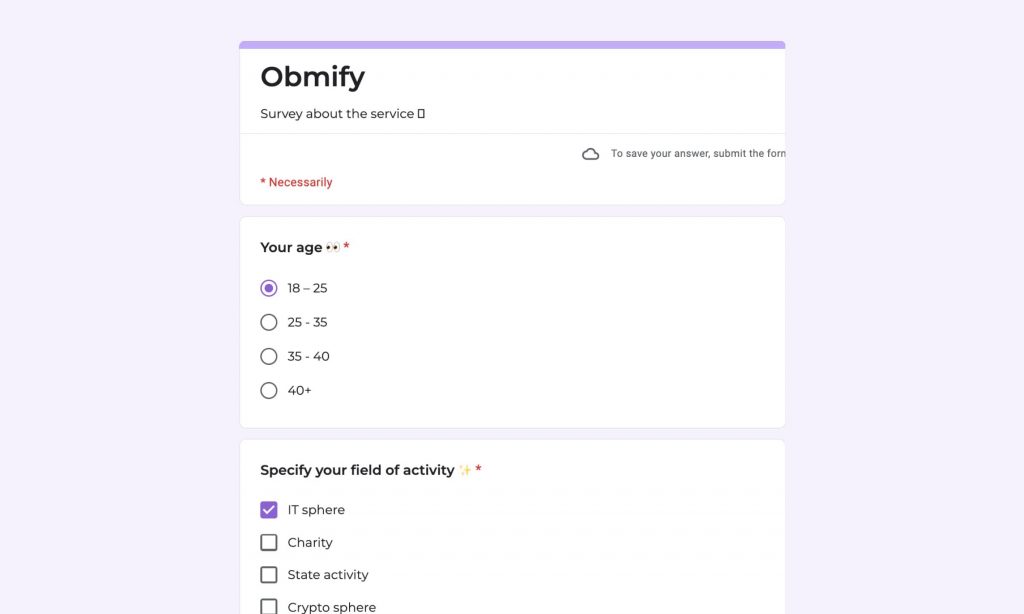
A research method that involves gathering data through questionnaires or online surveys.
Why do we use it?
To gather quantitative data on user behaviors, preferences, and opinions.
How do we do it?
We create surveys to collect quantitative data and gather user feedback at scale. The process involves designing survey questions (Google Forms), distributing the survey to the target audience, and analyzing the responses. The artifact obtained is a dataset of survey responses in Google Docs or Google Forms, allowing us to gather statistical insights, measure user satisfaction levels, and validate design decisions.
Conclusion
In summary, UX research plays a pivotal role in the product and service design process at Spaceberry Studio. By employing a comprehensive range of research methods, we gather crucial insights and make informed design decisions. Our designs are backed by user-centric principles, ensuring exceptional user experiences and meeting the unique needs of our clients. With a focus on custom web design, we strive to create visually appealing and user-friendly digital solutions. At Spaceberry Studio, we combine the power of UX research and our expertise in web design to deliver outstanding results that exceed client expectations.